I’ve been having a play with d3.js:
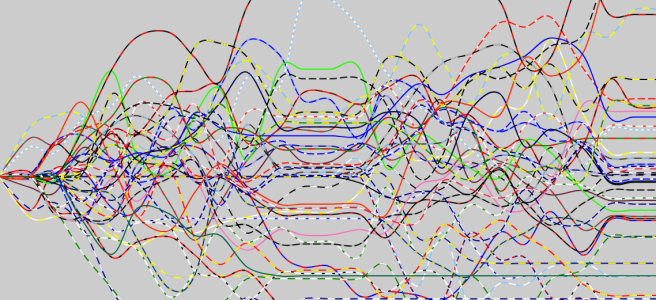
Rankings Chart

Like some kind of demented embroidery. Click to embiggen.
The heavier weighting of the end of season finals and play-offs stretches some gaps. The top French team benefits from the Top14’s extended play-off system.
Some charts filtered to just teams from specific leagues:


Biggest changes from last season:
| Scarlets | +22 | -26 | Connacht |
| Stade Francais | +21 | -18 | Toulouse |
| La Rochelle | +13 | -12 | Glasgow |
| Munster | +12 | -10 | Racing Metro |
| Gloucester | +8 | -10 | Montpellier |
Full Rankings Table
| Position | Difference from last season | Team | Points |
|---|---|---|---|
| 1 | +3 | Exeter Chiefs | 61.92 |
| 2 | +22 | Scarlets | 61.58 |
| 3 | +6 | Clermont Auvergne | 59.5 |
| 4 | -3 | Saracens | 59.25 |
| 5 | +2 | Wasps | 55.54 |
| 6 | +12 | Munster | 54.44 |
| 7 | +3 | Northampton Saints | 54.05 |
| 8 | -3 | Toulon | 54.01 |
| 9 | +21 | Stade Francais | 53.73 |
| 10 | +3 | Leinster | 53.4 |
| 11 | -3 | Ulster | 52.87 |
| 12 | -10 | Racing Metro | 52.67 |
| 13 | +2 | Leicester Tigers | 52.18 |
| 14 | +13 | La Rochelle | 51.38 |
| 15 | +6 | Harlequins | 51.05 |
| 16 | -10 | Montpellier | 50.7 |
| 17 | +5 | Bath Rugby | 50.59 |
| 18 | +8 | Gloucester Rugby | 50.44 |
| 19 | +4 | Brive | 50.21 |
| 20 | -6 | Cardiff Blues | 50.12 |
| 21 | -2 | Ospreys | 50.09 |
| 22 | -6 | Castres | 49.86 |
| 23 | -12 | Glasgow | 49.74 |
| 24 | Lyon | 49.68 | |
| 25 | +7 | Newcastle Falcons | 49.23 |
| 26 | +5 | Pau | 48.78 |
| 27 | -10 | Bordeaux Begles | 48.64 |
| 28 | -8 | Sale Sharks | 48.43 |
| 29 | -26 | Connacht | 48.08 |
| 30 | -18 | Toulouse | 47.73 |
| 31 | -3 | Edinburgh | 47.6 |
| 32 | +1 | Grenoble | 47.49 |
| 33 | -8 | Worcester Warriors | 46.59 |
| 34 | +4 | Benetton Treviso | 46.54 |
| 35 | Timisoara Saracens | 45.05 | |
| 36 | = | Calvisano | 44.34 |
| 37 | = | London Irish | 44.34 |
| 38 | Bayonne | 44.33 | |
| 39 | -10 | RC Enisei | 44.32 |
| 40 | -6 | Dragons | 43.22 |
| 41 | -2 | Agen | 43.02 |
| 42 | Bristol | 42.29 | |
| 43 | -8 | Zebre | 42.12 |
| 44 | -4 | Oyonnax | 41.95 |
